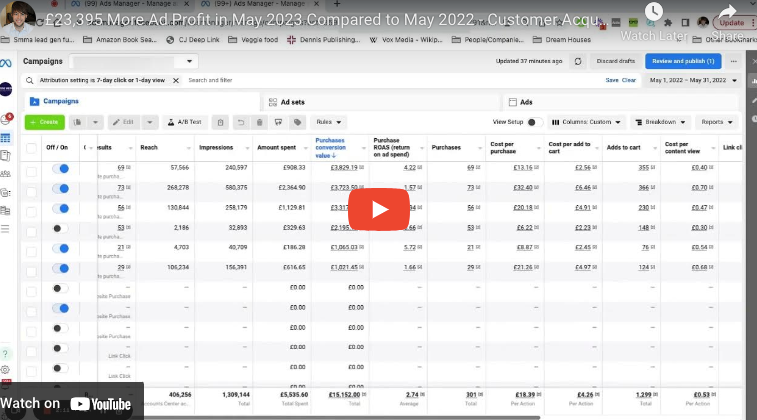
If you’re running paid ads for your DTC brand, ROAS is probably the first number you check every morning. It’s easy to understand, it’s on every dashboard, and a “good” ROAS feels like proof things are working.
Here’s the undeniable truth: ROAS can look completely healthy while your brand is quietly losing money on every single order.
What ROAS Actually Tells You (and What It Doesn’t)
ROAS — return on ad spend — is simply revenue generated divided by ad spend. A 4x ROAS means £4 in revenue for every £1 spent on ads. That sounds strong. But revenue isn’t profit.
ROAS says nothing about:
- Cost of goods sold (COGS)
- Shipping and handling
- Returns and discounts
- VAT or sales tax
- The actual cost of fulfilling that order
Strip all of that away, and the real picture is often far worse than the dashboard suggests.
The Metric That Exposes Reality
Contribution margin is what’s left after all variable costs — COGS, shipping, returns, discounts, VAT, and ad spend — are deducted from revenue. It’s the most honest profitability number in your business, because it can’t be dressed up by a strong top-line ROAS.
A brand can have a 4x ROAS and 25% product margins, 12% returns, and £8 average shipping cost — and still be acquiring customers at a loss without realizing it. The ad account looks healthy. The bank account tells a different story.
Why Most Brands Never Check This
Most brands don’t track contribution margin after ad spend because the dashboards they’re used to looking at aren’t built to show it. Meta and Google report on platform-level metrics — ROAS, CPA, CTR — because that’s what’s easy to measure automatically. None of it accounts for what happens to that revenue once COGS, returns, and fulfillment costs are subtracted.
The result: a brand can scale spend, watch ROAS hold steady, and still end up with thinner margins and a smaller cash cushion month over month — without a single metric on their dashboard flagging the problem.
What to Do About It
You don’t need new software to start seeing this clearly. Pull your last 30 days of orders and work through this:
Revenue generated − COGS − shipping & handling – processing fee’s − returns & discounts − VAT − ad spend = Contribution margin
If that number is thin, or negative, at your current spend level, scaling harder won’t fix it — it’ll just make the problem bigger, faster.
The Real Question
The question worth asking isn’t “is my ROAS good?” It’s “can my business actually absorb more scale, profitably?” Those are two very different questions, and only one of them protects your cash flow.
If you’re not sure what your true contribution margin looks like, that’s usually the first thing worth figuring out — before spending another pound scaling an acquisition engine that might be quietly working against you.