Ask most agencies how your ads are performing, and you’ll get ROAS, CPA, and CTR. Ask them what your contribution margin is, and you’ll often get a pause — because it’s a number that exposes reality, and not every agency wants that conversation with a client.
Here’s what it is, why it matters more than anything else on your dashboard, and how to calculate it yourself.
What Contribution Margin Actually Is
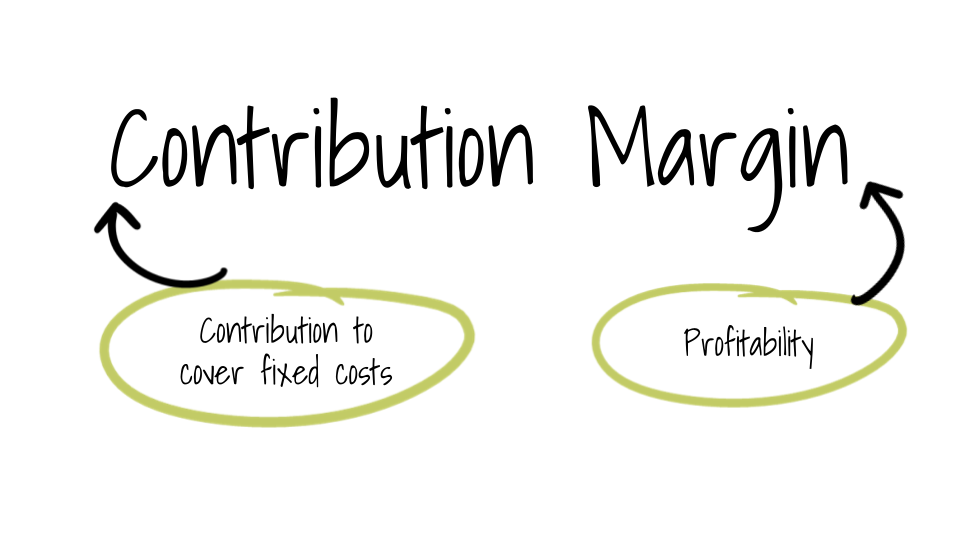
Contribution margin is the profit left over after every variable cost tied to acquiring and fulfilling a sale has been deducted. The formula is simple:
Revenue generated − COGS − shipping & handling − returns & discounts − VAT/sales tax − ad spend = Contribution margin
Notice what’s included that ROAS ignores entirely: the actual cost of making the product, the cost of getting it to the customer, and the revenue lost to returns. This is the difference between “revenue came in” and “we actually kept some of it.”
Why This Number Is Uncomfortable
Contribution margin is the metric most agencies avoid, because tracking it honestly means admitting when scaling isn’t working — even if the ad account looks busy and ROAS looks fine.
A brand with high revenue and a healthy ROAS can still be losing money on every acquisition if margins are thin and true acquisition costs are high. Contribution margin forces the full picture into view, which is exactly why it’s uncomfortable — and exactly why it matters.
Healthy Margins Are a Prerequisite, Not a Bonus
Here’s something worth internalizing: healthy product-level margins are a prerequisite for profitable scaling, not a nice-to-have. A common target is a 3:1 MER (marketing efficiency ratio) — but that target only makes sense if your margins can absorb it.
A brand with 70% gross margin can tolerate a lower MER comfortably. A brand with 30% gross margin needs a much higher one to stay profitable at the same spend level. There’s no universal “good” ROAS number — it always depends on what your margins can actually support.
What Changes Once You Track It
Once contribution margin becomes the number you’re actually managing toward — instead of ROAS or raw revenue — the whole conversation about scaling shifts. You stop asking “can we spend more?” and start asking “can this business absorb more spend, profitably?”
That single reframe is often the difference between a brand that scales into real profit and one that scales into a bigger, more expensive problem.
Try It Yourself
Pull your numbers from the last 30 days and run the calculation. If the result surprises you — in either direction — that’s useful information. It’s the clearest, most honest read you can get on whether your acquisition engine is actually working, or just looking like it is.