Most founders can quote last month’s revenue without thinking. Ask what they actually kept, and the answer gets a lot slower.
That gap — between the number on the Shopify dashboard and the number that’s actually yours to spend — is where most scaling decisions quietly go wrong. Not because founders are careless with money. Because the number they’re scaling against was never the real one to begin with.
Why “Revenue” Lies to You by Default
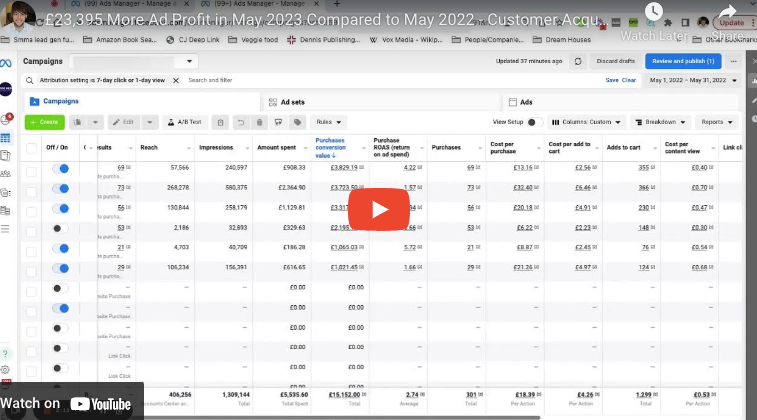
Shopify’s headline revenue figure includes shipping charged to customers and, depending on your settings, tax. Meta and Google report your ad-attributed revenue off their own tracking, which never subtracts a return that happens three weeks after the sale. Neither platform was built to answer the question that actually matters: after everything that comes out between a sale landing and the cash settling in your account, what’s left?
For most DTC brands, quite a lot comes out. COGS. VAT or sales tax. Shipping and fulfilment. Payment processing fees. Returns. Discounts. Chargebacks. Seven lines, each one invisible on a standard revenue dashboard, each one real money leaving before you see a penny of it.
The Seven-Line Waterfall
This is the exact structure we run every month on the accounts we manage — not a simplified version, the real one:
Gross Sales − COGS − VAT / sales tax − Shipping & fulfilment − Returns − Discounts − Chargebacks − Ad spend = Net Profit
Every one of those lines is a place profit disappears without a founder necessarily noticing, because none of them show up in the number Shopify puts at the top of the page.
Why We Don’t Skip the Discounts Line
Here’s a rule we apply that a lot of reporting quietly ignores: if £8,000 in discounts went out this month, the business only kept revenue net of that £8,000 — full stop, regardless of what drove it. A “successful” sale event that moved £50,000 of stock at 20% off didn’t generate £50,000. It generated £40,000, and every downstream decision — how much to spend acquiring the next customer, whether the quarter is actually profitable — should be made against that number, not the headline one. Recording it honestly isn’t pessimism. It’s the only way the rest of the waterfall means anything.
A Worked Example
Take a brand doing what looks like a strong month: £100,000 in gross sales.
COGS at 20% takes off £20,000. VAT at 5% (after adjustment for the way most platforms report it) takes off roughly £5,000. Shipping and fulfilment run 12% of revenue — another £12,000. Returns, a real cost in almost every category, sit at 15% — £15,000. No discounts ran this month. Chargebacks are usually small but non-zero — call it £1,500.
Revenue after those six lines: £46,500. Before a single pound of ad spend has been subtracted.
That’s the number that should be informing whether this was actually a good month — not the £100,000 at the top of the dashboard, and not even a platform-reported ROAS, which never touched any of these six lines in the first place.
The Quick Version, If You Want a Gut Check Today
You don’t need the full monthly build to get a directional read. Pull your gross sales for the last 90 days from Shopify Analytics, then find net sales — revenue after discounts, returns and chargebacks are removed (before COGS, shipping, or ad spend). Divide net by gross.
Above 80% and you’re in reasonably healthy territory. Between 70 and 80%, there’s room worth chasing down. Below 70%, something in returns, discounts, or chargebacks is eating a meaningful share of every sale, and it’s worth knowing which one before you spend another pound acquiring the next customer.
That single ratio isn’t the full picture — it stops before COGS, shipping and ad spend even enter the frame — but it’s a fast way to know whether the full seven-line version is worth running properly this week.
Run the Real Numbers
We built a calculator that does this properly — the gross-to-net check above, plus where your CPA sits against what a new customer actually leaves you before ad spend, plus your CAC payback period, all against the same green/amber/red read we use internally before we ever take on an account. It takes about five minutes with your own numbers.
[Run the Acquisition Health Calculator →] (Make a copy for your own use)
If what comes back surprises you, that’s normal — it’s usually the first time anyone’s shown a founder that number. If you want a second pair of eyes on what it means for your specific brand, that’s a conversation, not a pitch.